Random City of Ottawa Things
Housing Construction Summary for Q1 2023
In Q1 2023, there were:
- 2,716 dwellings granted land use permissions through Official Plan or Zoning By-law Amendments
- 10 of which were not-for-profit dwellings
- 4,621 dwellings approved through Plan of Subdivision, Plan of Condominium, Site Plan Control, Minor Variance, and Severance applications
- 3,187 net dwellings issued building permits
- 1,626 housing starts
- 14,945 dwellings under construction
- 579 of which are not-for-profit dwellings
- 2,135 dwellings where construction was completed
Wards
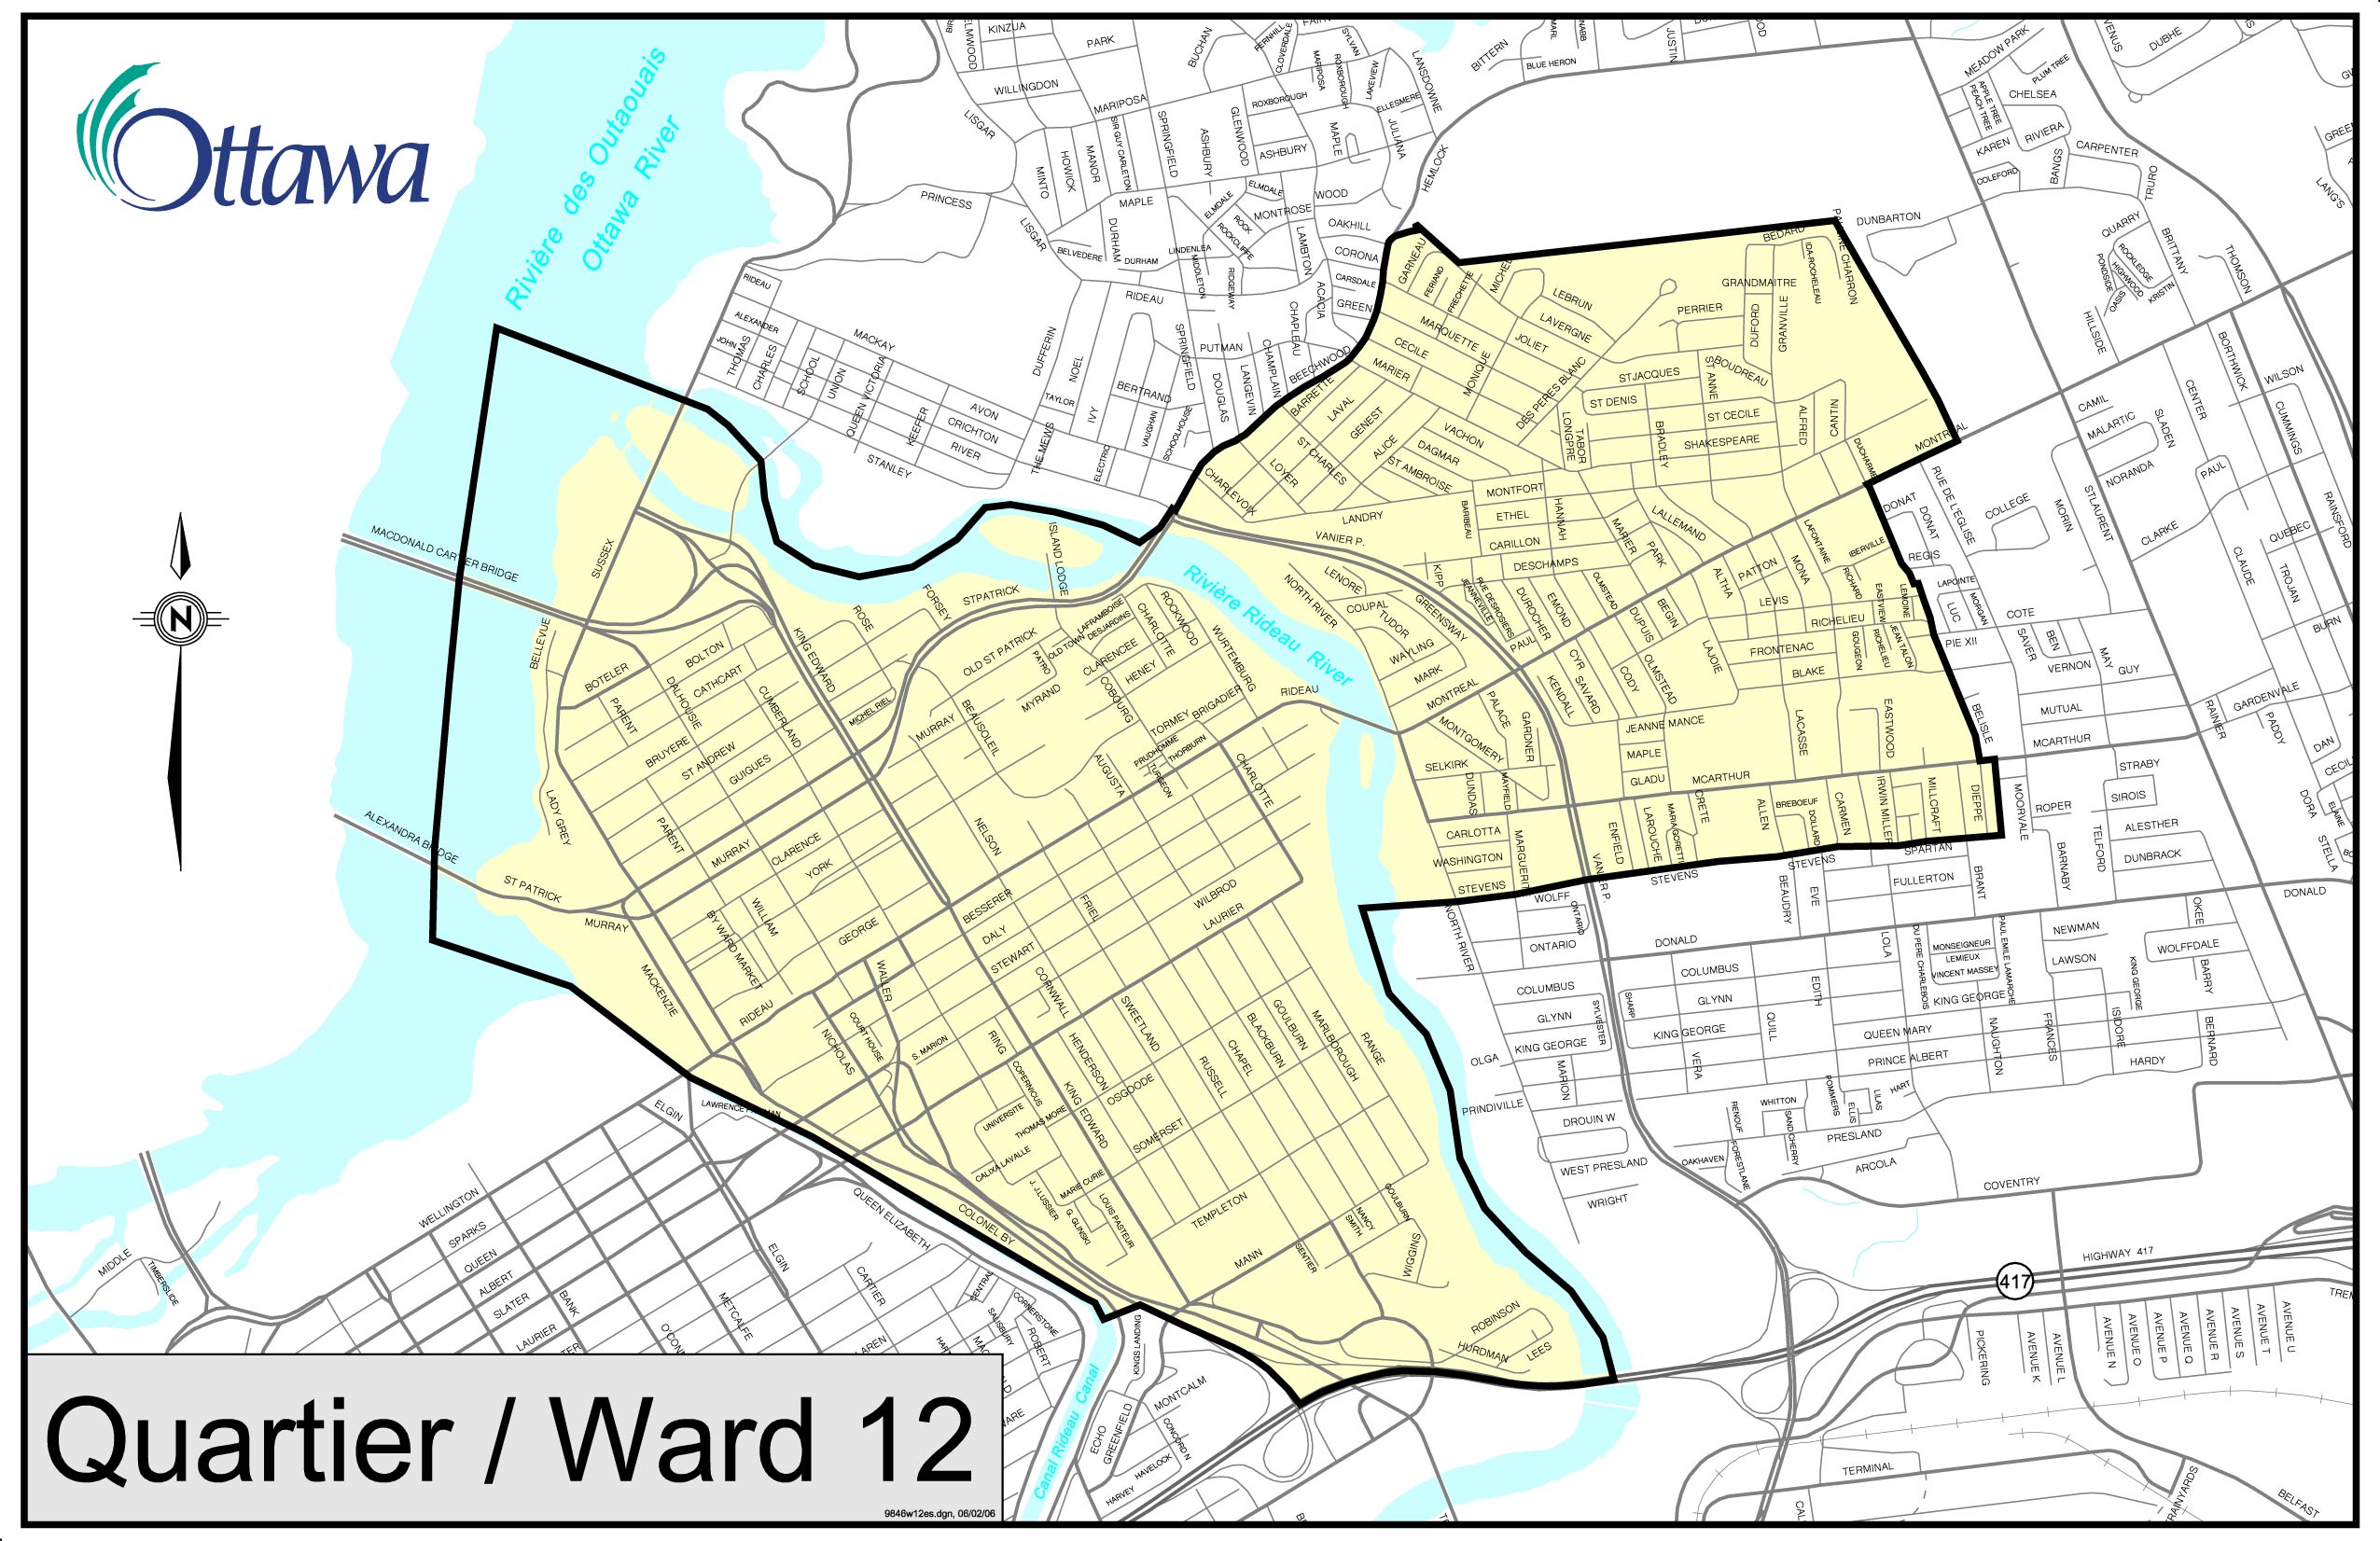
The City of Ottawa is divided into 24 wards. Each ward has a councillor who represents the residents of that ward.

Property Taxes
The City of Ottawa collects property taxes from residents to help pay for services such as roads, parks, and public transit.
Probing Questions
Reviewing the data in the following table, answer the following questions:
- Which ward has the highest property tax revenue?
- Which ward has the lowest property tax revenue?
- What is the total property tax revenue for the City of Ottawa?
- What is the difference in size between the ward that collects the most property taxes and the ward that collects the least?
Ward specific data
| Ward | Ward Name | Municipal Taxes | Percent of Total |
|---|---|---|---|
| 1 | ORLÉANS EAST-CUMBERLAND | 76,175,204 | 3.75% |
| 2 | ORLÉANS WEST-INNES | 66,504,224 | 3.27% |
| 3 | BARRHAVEN WEST | 89,847,966 | 4.42% |
| 4 | KANATA NORTH | 100,674,860 | 4.96% |
| 5 | WEST CARLETON-MARCH | 41,848,481 | 2.06% |
| 6 | STITTSVILLE | 86,734,417 | 4.27% |
| 7 | BAY | 90,814,792 | 4.47% |
| 8 | COLLEGE | 92,745,516 | 4.57% |
| 9 | KNOXDALE-MERIVALE | 83,979,020 | 4.13% |
| 10 | GLOUCESTER-SOUTHGATE | 81,538,410 | 4.01% |
| 11 | BEACON HILL-CYRVILLE | 68,023,631 | 3.35% |
| 12 | RIDEAU-VANIER | 111,861,953 | 5.51% |
| 13 | RIDEAU-ROCKCLIFFE | 82,026,391 | 4.04% |
| 14 | SOMERSET | 198,629,780 | 9.78% |
| 15 | KITCHISSIPPI | 98,468,851 | 4.85% |
| 16 | RIVER | 77,794,332 | 3.83% |
| 17 | CAPITAL | 94,693,764 | 4.66% |
| 18 | ALTA VISTA | 93,484,569 | 4.60% |
| 19 | ORLÉANS SOUTH-NAVAN | 84,471,284 | 4.16% |
| 20 | OSGOODE | 50,198,912 | 2.47% |
| 21 | RIDEAU-JOCK | 50,347,696 | 2.48% |
| 22 | RIVERSIDE SOUTH-FINDLAY CREEK | 64,086,253 | 3.16% |
| 23 | KANATA SOUTH | 77,107,277 | 3.80% |
| 24 | BARRHAVEN EAST | 68,916,398 | 3.39% |
| Total | CITYWIDE | 2,030,973,981 | 100% |
Ward Councillor Evaluation Form
Rents too high? Not enough housing options in your neighbourhood. OCTranspo buses constantly late or not arriving at all. OTrain shut down again? Do you have to ride your bike on a sidewalk because the roads you use aren't comfortable and don't have a protected bike lane?
These are all examples of areas of responsibilities that fall to the city and to the mayor and local councillors. Let your councillor know what you think about the job they are doing. Fill out the form below to provide your feedback.
